
Service Utilization Dashboard
Problem: Service teams need a clearer view of technician time, billable work, non-billable activity, and effective utilization across branches.
Tools: SQL, Power BI, operational reporting, dashboard design
View SolutionSolutions
Examples of operational dashboards, reporting systems, data pipelines, and automation for recurring business reporting.
Problem: Service teams need a clearer view of technician time, billable work, non-billable activity, and effective utilization across branches.
Tools: SQL, Power BI, operational reporting, dashboard design
View Solution
A lightweight reporting utility for running saved SQL queries, exporting CSV/Excel outputs, and logging successful or failed jobs. Built to reduce repetitive manual reporting work.
Tools: Python, SQL, CSV/Excel exports, configuration files, logging
View Solution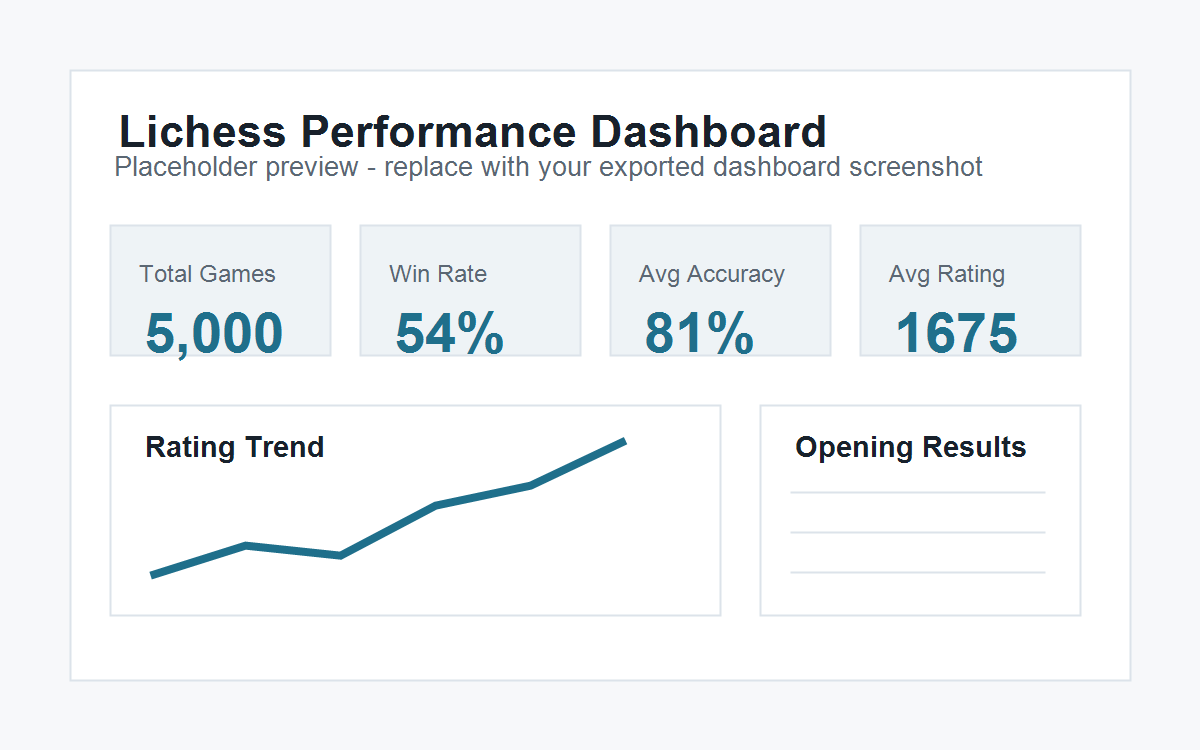
Problem: Chess performance data from the Lichess API needs to be extracted, cleaned, modeled, and presented in a useful dashboard format.
Tools: Lichess API, Python, CSV, Power BI, DAX
View Solution